
Every day, entrepreneurs face the need to process large data sets: results of advertising campaigns, sales, conversions, number of visits, etc. If you analyze them competently, you can develop your business projects with high efficiency and solve various tasks, regardless of their complexity.
Why do you need business analytics?
Businesses of every organization are based on making different decisions at different levels in the management hierarchy. The analytics center staff, sales managers, and executives are all involved in the process. So what to base the right decisions on?
The information collected, of course. It must be provided in a timely manner, as well as structured and competently presented.
Only with the right analytics can you prepare effective decisions based on current factors and conditions. In times of digital transformation, untimely response to changes can lead to business destruction.
Microsoft Excel office suite has special add-ins Power Query and Power Pivot to handle heavy data sets with ease. Power Query connects and processes sources in arbitrary formats, while Power Pivor performs complex calculations and generates data models.
How to use the Power Pivot add-in to analyze information
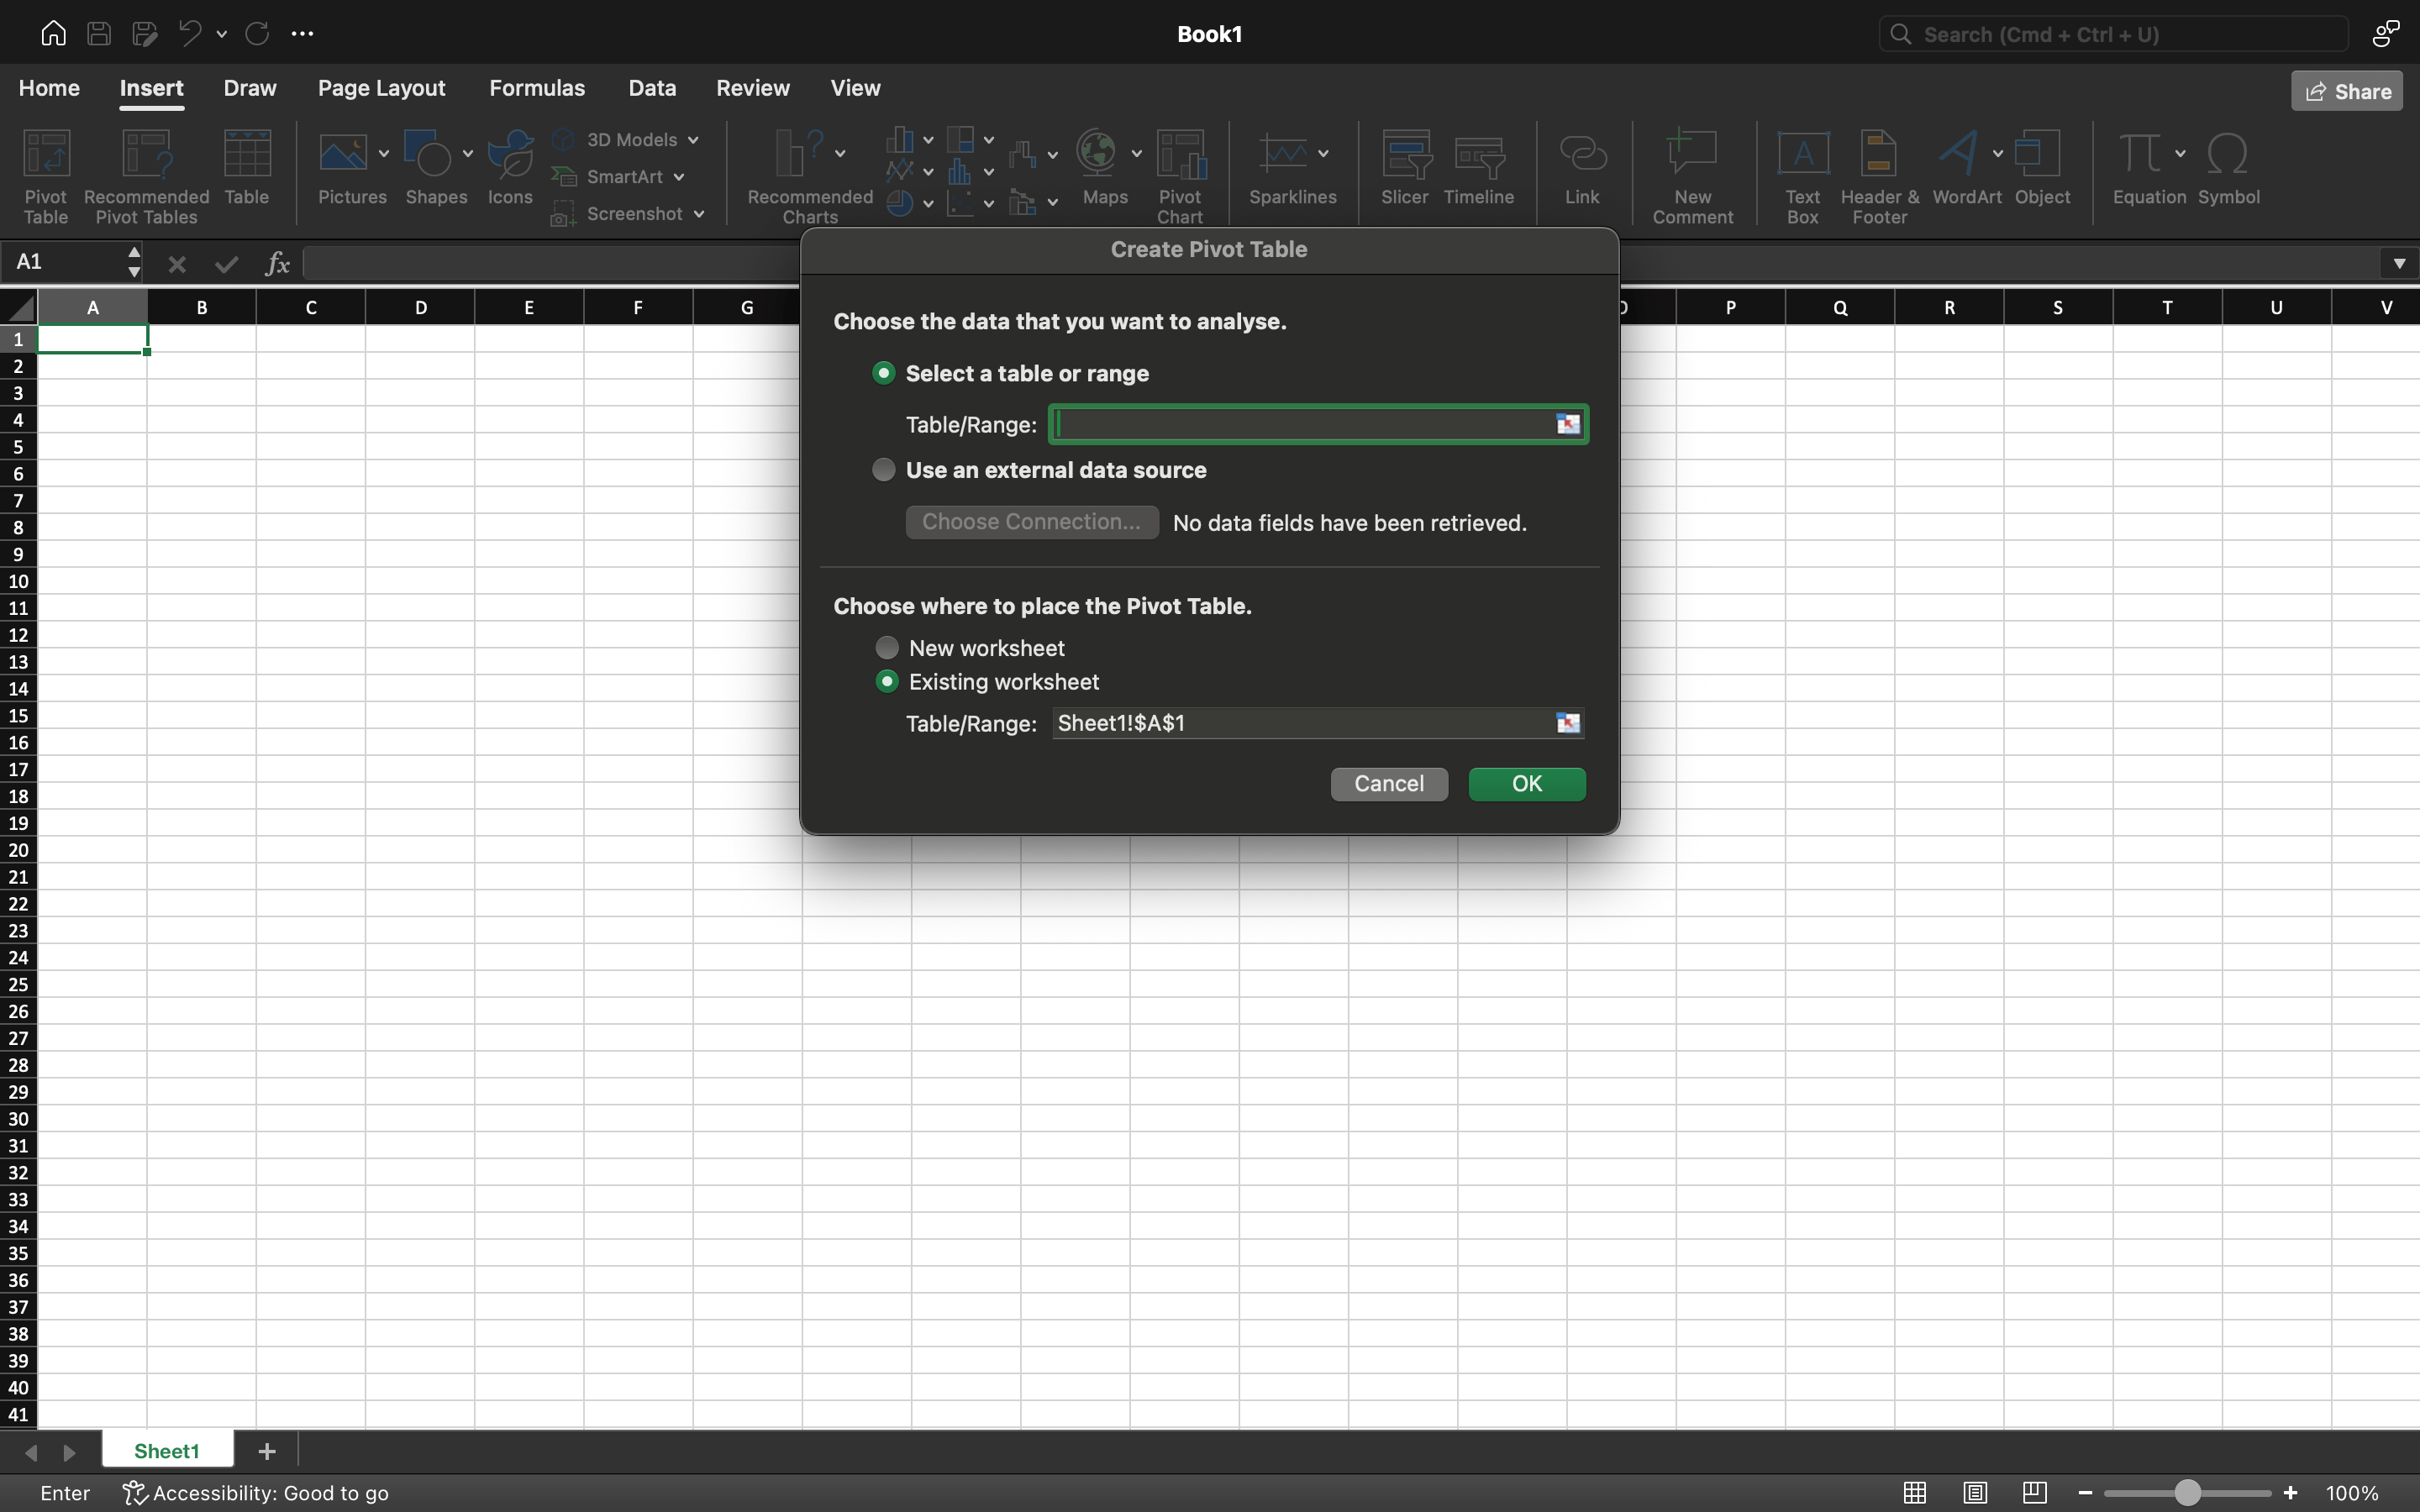
Power Pivot is a built-in solution within Excel for processing and analyzing various data. With this add-in, you can add information from different sources to form a single database. The key advantage of the tool is that there are no limitations in terms of the number of rows. In the standard mode, Excel allows the use of 1,048,000 rows, but when using Power Pivot, the value increases significantly without reducing performance.
Therefore, when processing significant amounts of data in different formats and interacting with complex structures, this tool is of particular benefit, allowing you to analyze data with high efficiency.
Read also: How to make summary tables in Excel
The Power Pivot window in all versions of Excel since 2010 has a similar design. To open this form, you need to go to the Power Pivot settings and find the “Manage” button. If the tab is missing, make sure you are using the current version of Excel. You will probably have to add it manually to fully utilize the Power Pivot functionality.
How Power Query works
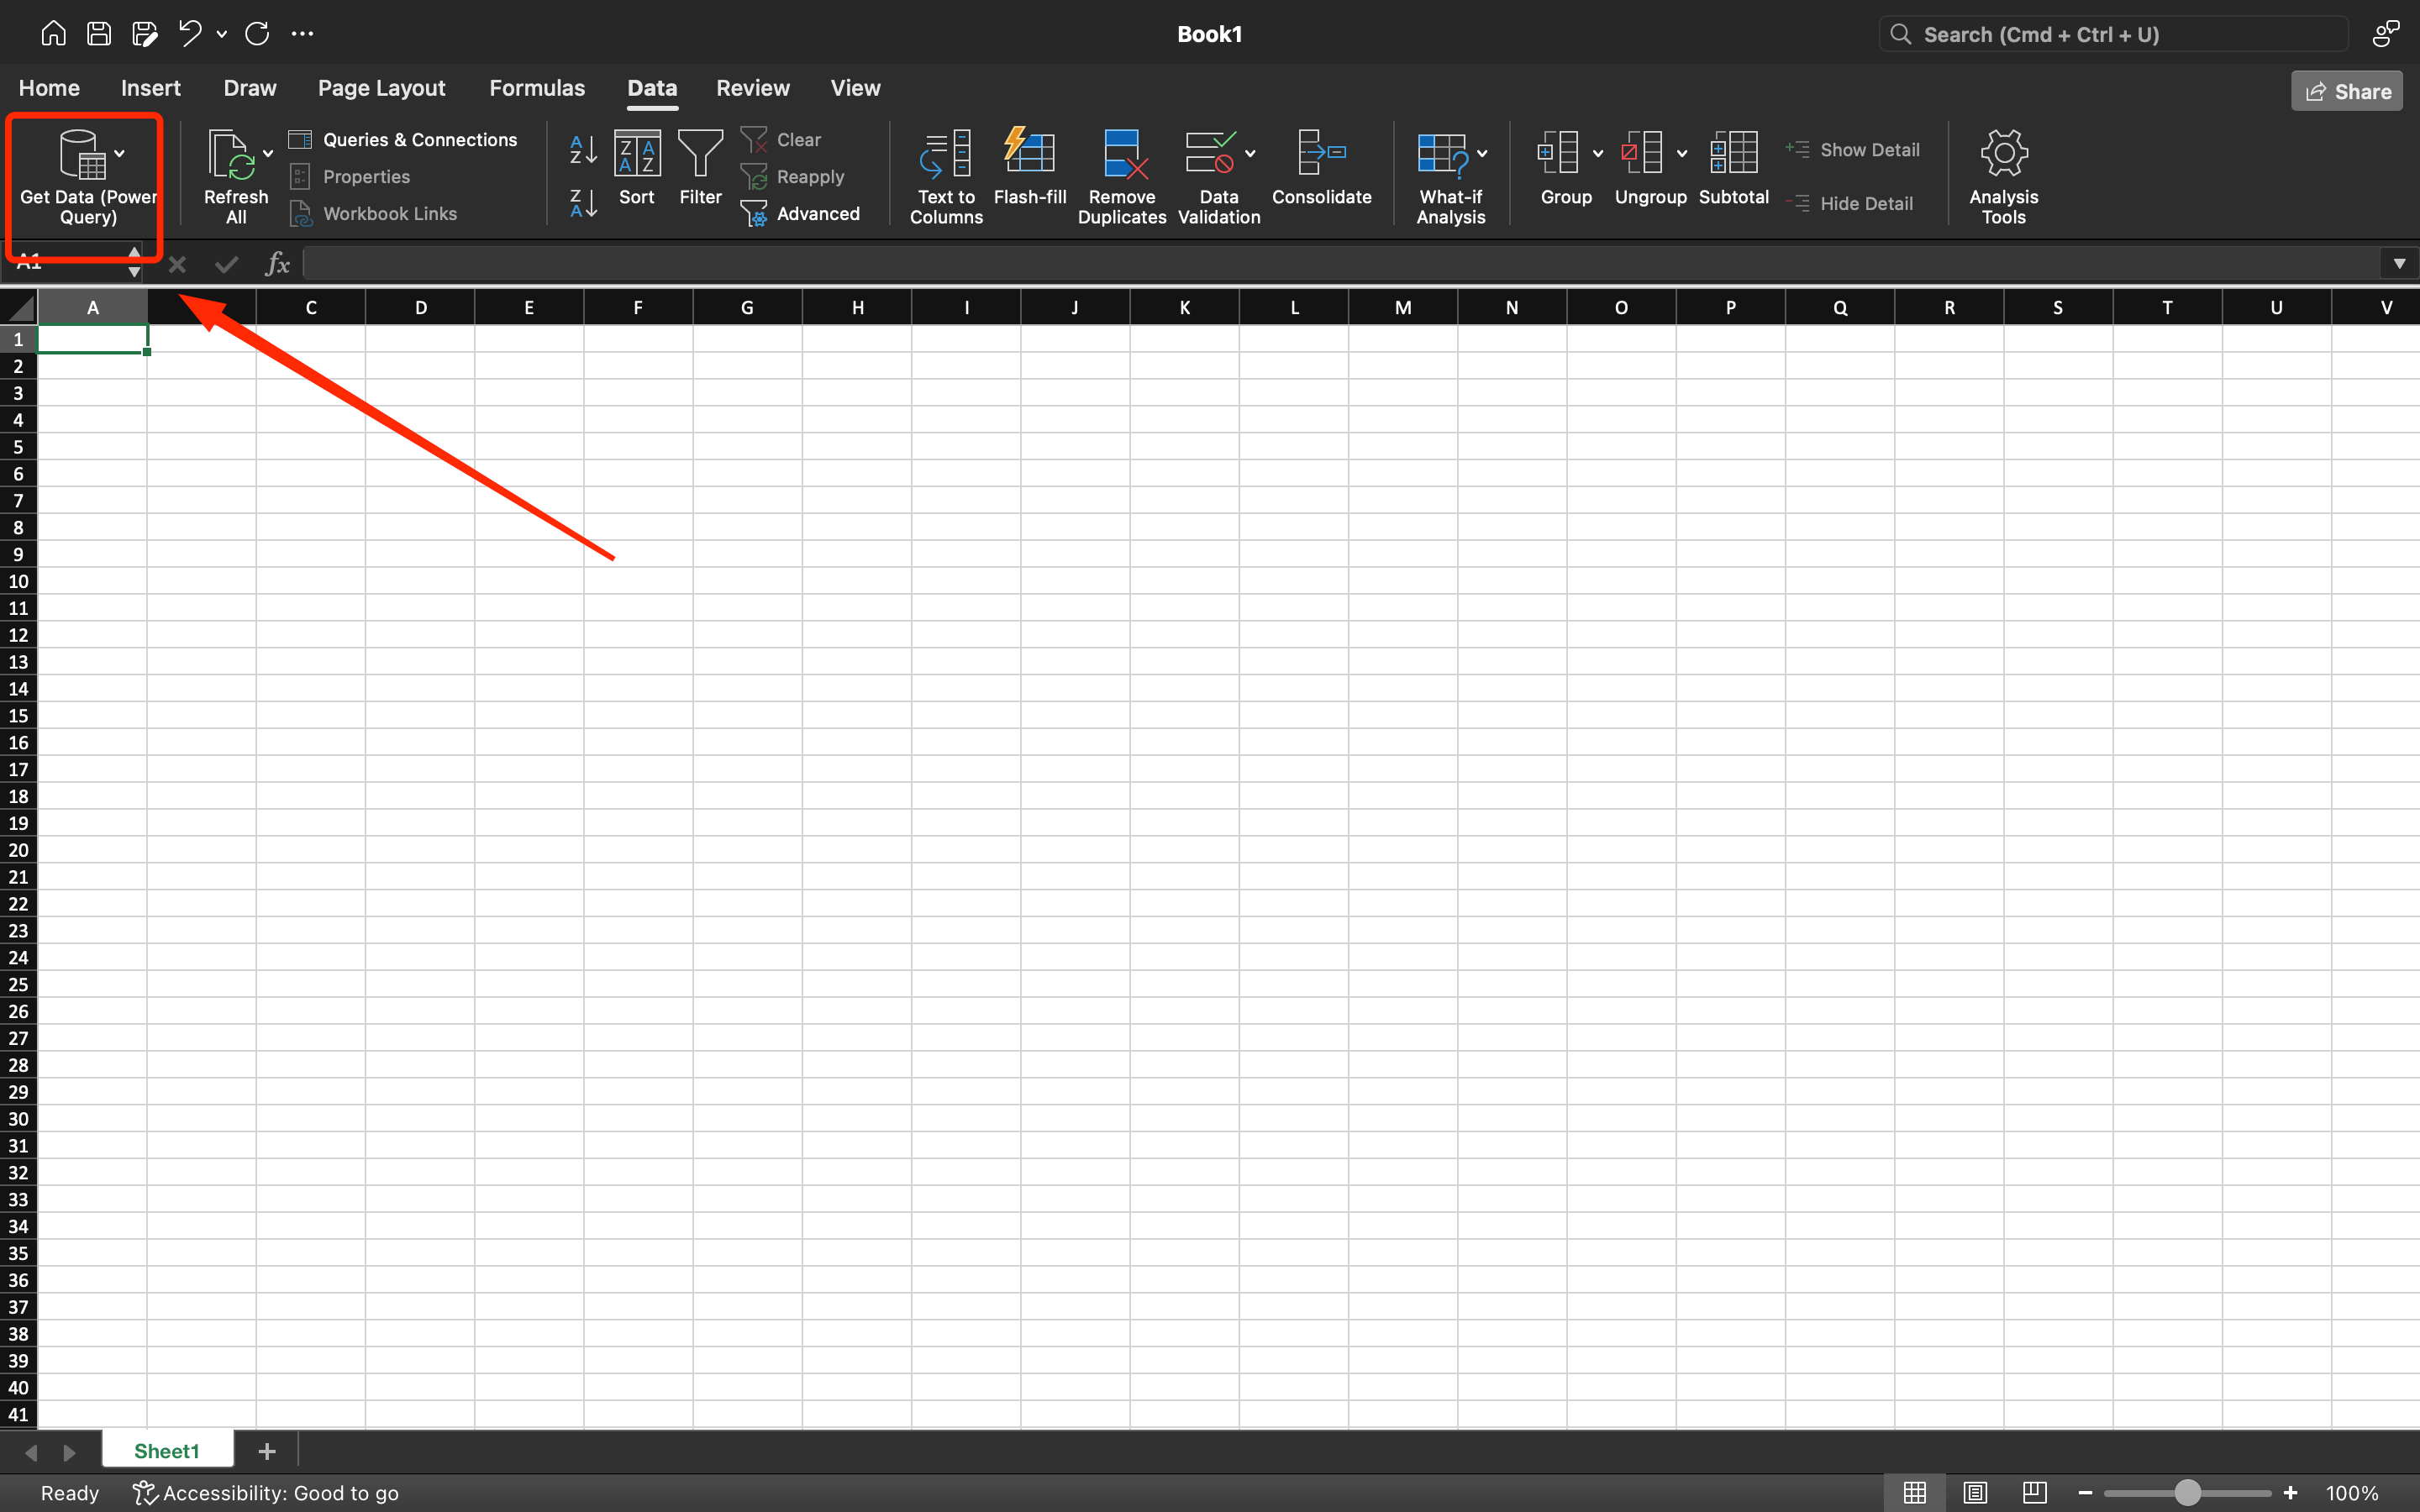
The Power Query add-in is another highly effective tool within Office Excel that gives you access to advanced data management customizations. Previously, users had to perform complex manipulations to convert information manually or with the help of VBA-based macros. Now it can be accomplished in just a couple of clicks.
Power Query allows you to create queries for importing, cleaning or transforming information. The tool automatically prepares the code for each query and the client does not need to manually write the code. The tool’s user interface looks simple and intuitive, and most operations are easy to perform with a mouse.
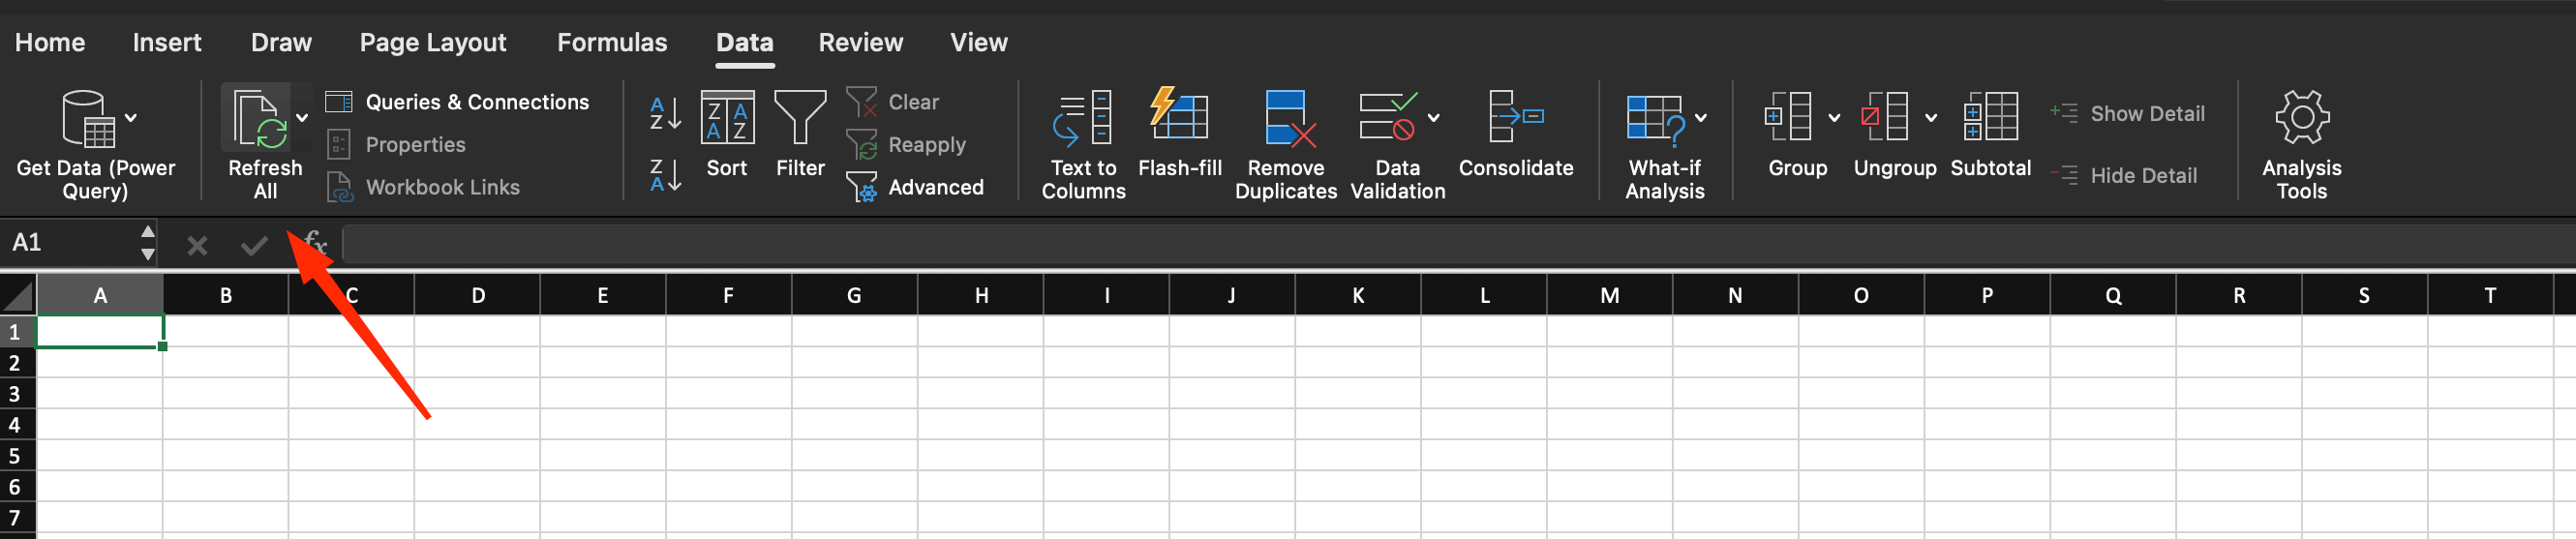
Many data transformations take place without writing code combinations. Queries are added to the clipboard and are suitable for reuse, as the information is updated after clicking on the refresh keys in the Data section.
Some of the main features of Power Query include items such as:
- Through Excel, you can immediately connect to various sources of information including csv, databases, excel documents, folders and more.
2. Information from connected sources is suitable for conversion in various ways: sorting, filters, substitution, performing calculations, merging, and more are available.
3. Converted parameters can be easily imported, uploaded to a sheet, summary page, or data model like Power Pivot.
Adding Power Pivot and Power Query settings from the menu
To activate Power Query and Power Pivot features through Excel menus, you need to enable the corresponding add-ins, which are specified in the program version. If they are not present in the window of your office suite, you should perform the following operations:
- Open the File menu.
2. Find the “Options” item.
3. Go to the “Add-ons” section.
4. Select “COM Add-ons” from the drop-down list.
5. Find the “Go to” box.
6. Specify the required add-ins and add them.
How do I use add-ins to prepare business intelligence reports in Excel?
The Power Pivot and Power Query tools described above open up advanced capabilities for deep and detailed business analytics, and also work well with summary tables. In practice, this allows you to generate detailed analytical reports. Data processing is often performed according to the following algorithm:
- Power Query connects to different sources of information and processes them.
2. Data is loaded into Power Pivot in a flat table format with the number of rows restrictions bypassed.
3. All complex calculations occur through Power Pivot.
4. Reports are generated through summary tables, charts, and other controls, including filters and timelines.
Reports generated in this way are customized all the time. In case of subsequent updates, the data is updated automatically.
It is no secret that in the current realities, when looking for employees in management departments, special attention is paid to the ability to analyze information. But there is no standardized analytics system in many companies. Therefore, working with Excel Power Query and Power Pivot add-ins will be a significant competitive advantage in professional advancement.


